To recap, we had got as far as running our playmode tests on the cloud machine, but we had to use the -batchmode -nographics command line parameters. If we don’t, we get tons of errors about non-interactive window sessions. But if we do, we can no longer rely on animation, physics, or some coroutines during our tests! This limits us to basic lifecycle and validation tests, which isn’t great.
We need our cloud machine to pretend there’s a monitor attached, so unity can run its renderer and physics.
To do this, we’re going to set up a non-admin windows account on our cloud machine (because that’s just good practice), get it to auto-login on boot and ask it to connect to jenkins under this account. Read on for more details.
First, set up your new windows account by remoting into the admin account of the cloud machine:
type “add user” in the windows start menu to get started adding your user. I call mine simply “jenkins”. Remember to save the password somewhere safe!
We need to be able to remote into the new user, so go to System Properties, and on the Remote tab click Select Users, and add your jenkins user
if jenkins has already run on this machine, you’ll want to give the new jenkins user rights to modify the c:\Workspace folder
You’ll also want to go into the Services app, find the jenkins service, and disable it.
From the remote desktop of the jenkins user account, open a browser and log into your jenkins server
Go to the node page for your new machine, and configure the Launch Type to be Launch Agent By Connecting It To The Master
Switch to the node’s status tab and you should have an orange button to download the agent jnlp file
Put this file in the %userprofile%\AppData\Roaming\Microsoft\Windows\Start Menu\Programs\Startup folder
Change the Launch Type back to whatever you need (we use the Slave Setup plugin, despite the icky name https://plugins.jenkins.io/slave-setup/) — it doesn’t need to stay as Launch Agent By Connecting It To The Master.
We’re done. log out of remote desktop and reboot the machine. You should see it come alive in the jenkins server after a few minutes. If you remove the -batchmode and -nographics options from your unity commands, you should see the tests start to run with full physics and animation!
This is the third of a series of posts on Jenkins and Unity.
In this post I’ll outline how I set up Jenkins to make reliable repeatable Unity builds, using a pipelines script (also called a jenkinsfile) that’s stored inside source control. I’ll outline the plugins I used and the reasons behind some of my choices. This is not a tutorial in Jenkins or pipeline scripts. It’s more of a tour.
I’m not an expert in Jenkins – most of this is pieced together from the Pipeine docs and google. It may be that there are better ways to achieve the same results – I’d be keen to hear about them in the comments!
This post just deals with the jenkinsfile. In a future post I’ll deal with how I configured Jenkins to use it.
I am using Jenkins v2.257.
Why Pipelines?
You can set up Jenkins to do almost anything you want via the web interface. This is ok for experimenting, but it has drawbacks:
config changes aren’t easy to document
nor can they be rolled back
it’s hard to share common build setups between related Jenkins jobs
All these go away if we move to a piepelines script stored in a file (commonly called “the jenkinsfile”) within the project’s source control.
Supported jobs
In Jenkins, a “job” is a particular way of building your project. This one jenkinsfile will run multiple jobs for us:
VCS Push: every time anyone pushes to SVN, Jenkins will pull latest, run some quick automated tests, and make a build. If any step fails, Jenkins reports a failure. The build artifact is thrown away.
Health Check: on a schedule, multiple times a day, Jenkins will do some more time-consuming automated tests, and make a build. If any step fails, Jenkins reports a failure. The build artifact is thrown away.
Deploy: at 6am and 12pm, do everything Health Check does, but make the result available to QA. They’ll then smoke the build further and make it available to everyone else if it’s good.
The Health Check build exists because there’s a big gap between our 12pm build and the next day’s 6am build. If someone commits something at 1pm that would fail the slow automated tests, we might not know until the next morning, and the QA build will already be late. Now the Health Check build runs multiple times in the afternoon, and we can fix stuff before we log off for the day.
File structure
When you’re googling for pipelines info, you’ll discover it’s a concept that has undergone a few revisions. What we’re talking about here is a “declarative pipeline” (as opposed to the older “scripted pipeline”), which is (mostly) composed of a jenkinsfile written in a subset of the Groovy language, which runs on the JVM.
A declarative pipelines script is roughly defined as a series of “stages”, where each stage is a series of commands, or “steps”. Stages can be hierarchical and nest and run in parallel, but for our purposes, we’re going to stay pretty linear and flat. If any stage fails, the subsequent stages won’t run.
We’re going to have six stages:
Clean – we’ve all had corrupted library files, and sometimes you want to make really sure you’re starting from scratch.
Prewarm – getting things ready so we can start the builds
Editmode Tests – fast declarative-style tests running under the Unity Test Framework
Playmode Tests – slower tests that require running the game. See my recent post about running playmode tests on Jenkins.
Build – we always care if this succeeds, but depending on the job we may throw away any produced artifact. We want to capture those #if UNITY_EDITOR errors!
Deploy – putting the build artifact somewhere useful. This is somewhat project-dependent and, at the moment, confidential, so I will only give the briefest outline of this step.
Metadata
You’ll find the full jenkinsfile at the bottom of the page, but let’s break it down by starting at the top.
The pipeline itself doesn’t start until the pipeine keyword, but since this is a subset of Groovy, we can define constants at the top.
There’s probably a better service-orientated way of installing and locating Unity, but in this case we chose to just manually create a windows machine on ec2, remote desktop in, and install Unity. Ship it.
Next we start the pipeline, and define parameters. These appear as dropdowns when starting a job in Jenkins, and you access them further down the script using params.PARAMETER_NAME:
pipeline {
    parameters {
        choice(name: 'TYPE', choices: ['Debug', 'Release', 'Publisher'], description: 'Do you want cheats or speed?')
        choice(name: 'BUILD', choices: ['Fast', 'Deploy', 'HealthCheck'], description: 'Fast builds run minimal tests and make a build. HealthCheck builds run more automated tests and are slower. Deploy builds are HealthChecks + a deploy.')
        booleanParam(name: 'CLEAN', defaultValue: false, description: 'Tick to removed cached files - will take an eon')
        booleanParam(name: 'SKIP_PLAYMODE_TESTS', defaultValue: false, description: 'In an emergency, to allow Deploy builds to work with a failing playmode test')
    }
Here’s how they appear in Jenkins in the Build With Parameters tab:
More details on each param:
Type: we’ll pass this option directly to our Unity build function, which will set various scripting defines as required.
Build: this is used only within the jenkinsfile, to switch different parts of the pipeline in and out. It correlates with the job types mentioned above.
Clean: sometimes you gotta nuke the site from orbit
Skip Playmode Tests: a nod to practicality – I love automated tests but very rarely you know the test failure is manageable, and you need a build right now. In practice our team rarely uses this option.
Here follows some boilerplate for Jenkins to understand how to run our job:
agent {
    node {
        label "My Project"
        // force everyone to the space space, so we can share a library file.
        customWorkspace 'workspace\\MyProject'
    }
}
options {
    timestamps()
    // as a failsafe. our build tend around the 15min mark, so 45 would be excessive.
    timeout(time: 45, unit: 'MINUTES')
}
The node block is about finding an ec2 instance to run the job on. We’ll deal with ec2 setup in a future post. The customWorkspace setting is a cost-saving measure: on ec2, the size of persistent SSD storage is a significant part of our costs. We could save money by switching to spinning rust, but we want the build speed of an SSD. Instead, we’ll try to keep SSD size down by not having multiple versions of the same project checked out all over the drive. In practice, we mostly only work in trunk anyway, and when we build another branch it’s not massively divergent. We may revisit this over the course of the project.
Clean
Our first stage! It’s pretty simple. It only runs if the Clean parameter has been set, and it just runs some dos commands to clean out the library and temp folders:
(I’m surprised that using the boolean Clean param in a when block isn’t easier? I may have missed some better syntax)
Prewarm
Prewarm helps set the stage for the coming attractions. We’re going to use some script blocks here to drop into the old scripted pipeline format, which lets us do some more complex logic.
The first thing we want to do is figure out what branch we’re on. Jenkins will always run your pipeline with some predefined environment variables, including some which seem to imply they’ll contain your branch name, but try as I might they didn’t seem to work for us. Maybe it’s because we’re using SVN? So I had to figure it out for myself:
stage('Prewarm') {
steps {
script {
// not easy to get jenkins to tell us the current branch! none of the built-in envs seem to work?
// let's just ask svn directly.
def get_branch_script = 'svn info | select-string "Relative URL: \\^\\/(.*)" | %{\$_.Matches.Groups[1].Value}'
env.R7_SVN_BRANCH = powershell(returnStdout: true, script:get_branch_script).trim()
}
We’ll call out to powershell because urgh grepping in dos is esoteric. We’ll store it in a new env variable, which will let us use this info in future stages.
Next we’ll set up the build name:
buildName "${BUILD_NUMBER} - ${TYPE}@${env.R7_SVN_BRANCH}/${SVN_REVISION}"
script {
if (params.BUILD == 'Deploy') {
buildName "${env.BUILD_DISPLAY_NAME} ^Deploy"
}
if (params.BUILD == 'HealthCheck') {
buildName "Health Check of ${TYPE}@${env.R7_SVN_BRANCH}/${SVN_REVISION}"
}
if (params.BUILD == 'HealthCheck' || params.BUILD == 'Deploy') {
// let's warn that a deploy build is in progress
slackSend color: 'good',
message: ":hourglass: build ${env.BUILD_DISPLAY_NAME} STARTED (<${env.BUILD_URL}|Open>)",
channel: "project_builds"
}
}
the buildName command lets you set your build name, and env.BUILD_DISPLAY_NAME contains the current version of that. The default Jenkins build name is just “#99” or whatever, which is less than helpful. Here, we’ll make sure it’s of the format “JenkinsBuildNumber – Type@Branch/Changelist [^Deploy]”. It’ll then be obvious from a glance in both the Jenkins dash and slack notifications what’s building and why.
We also send a slack notification of health check and deploy builds, since it’s useful to know they’ve started. It gives people a good sense of if their commits have made it into the build or not. More on notifications below.
Next some more housekeeping for the automated tests, which communicate with Jenkins via xml files:
// clean tests
bat "if exist *tests.xml (del *tests.xml)"
Finally, we’ll open Unity once and close it. One persistent problem with Unity in automated systems is of serialisation errors from out-of-date code working with new data. For instance, let’s assume you’ve got a bunch of existing scriptable assets, and your latest commit refactors them. On the build server, Unity will open, validate the assets with the pre-refactor code that it has from the last run, throw some errors because nothing looks right, then rebuild the code. Subsequent launches will succeed because both the data and the code are in sync. So, to keep those spurious errors out of real build logs, we’ll do this kind of ghost-open:
This is the first time we’ve seen Jenkinfile talk to Unity! We’ll explain more in the next section, but just pretend you understand it for now. The important part is -MyTestOnly, which tells our build function to only set script defines, recompile, and quit.
We wrap the whole thing into a retry block as a side effect of us building multiple branches in one workspace. Sometimes, we get a “library corrupted” failure when switching. Running a second time makes it go away – no explicit Clean required. Lots of getting Unity running on Jenkins is just experimenting and making do with what works!
You also see some examples of groovy’s string interpolation. I admit I’m no expert, bu there seems to be about a dozen ways of doing string interp in groovy, and not all approaches work in all locations. If one didn’t work, I went on to the next, and what you see here is the one that works here.
Talking to Unity
We need to convince Unity to do what we want, and we want any failures to produce useful output in the Jenkins dashboard. You can find more in the Unity docs but I found the best way to get output was to have -logFile last, with no path set.
To convince Unity to do what we want, we use the -executeMethod parameter. That will call a static c# function of your choice. How to make builds from within Unity is outside the scope of this blog post.
Here’s our next few stages, and the various ways they call to Unity:
stage ('Editmode Tests') {
steps {
bat "\"${UNITY_PATH}\" -nographics -batchmode -projectPath . -runTests -testResults editmodetests.xml -testPlatform editmode -logFile"
}
}
stage ('Playmode Tests') {
when {
expression {
return (params.BUILD == 'Deploy' || params.BUILD == 'HealthCheck') && !params.SKIP_PLAYMODE_TESTS
}
}
steps {
// no -nographics on playmode tests. they don't log right now? which is weird cuz the editmode tests do with almost the same setup.
bat "\"${UNITY_PATH}\" -batchmode -projectPath . -runTests -testResults playmodetests.xml -testPlatform playmode -testCategory \"BuildServer\" -logFile"
}
}
stage ('Build') {
steps {
bat "\"${UNITY_PATH}\" -nographics -buildTarget Win64 -quit -batchmode -projectPath . -executeMethod MyBuildFunction -MyBuildType \"${params.TYPE}\" -logFile"
}
}
Deployment
This is project and platform specific, so I won’t go into details, but let’s assume you’re zipping or packaging a build folder and sending somewhere.
Here we’d be able to use the branch environment variables to maybe choose a destination folder. We’re also able to reuse the build name environment variables. We created both of those in Prewarm.
stage ('Deploy') {
when {
expression { return params.BUILD == 'Deploy' }
}
steps {
// ... how to get a build to your platform of choice ...
slackSend color: 'good', message: ":ship: build ${env.BUILD_DISPLAY_NAME} DEPLOYED (<${env.BUILD_URL}|Open>)", channel: "project_builds"
}
}
We also post that the build has been deployed. More on notifications below.
Notifications and wrap-up
The post section of the jenkinsfile contains blocks that will run after the main job, in different circumstances. We mostly use them to report progress to slack:
The first step here is to always report the automated test results to Jenkins with the nunit plugin. Unity’s test reports are in the nunit format, and this plugin converts it to the junit format that Jenkins expects.
We post all failures to the slack channel, and all fixed builds, but we don’t post all successes. With builds on every push that might make the build channel too noisy. We do however post when Health Checks succeed, since that’s good affirmation.
We use the Slack Notification plugin. The slack color attributes here doesn’t seem to work for us? So we use emojis to make it easy to scan what’s happening. Here’s an example from slack:
Porting an existing job to pipelines
Jenkins includes a snippet generator, which allows you to make freestyle blocks and see the generated pipeline script, which is very handy for porting freestyle jobs:
The full file
UNITY_PATH = "C:\\Program Files\\Unity\\Hub\\Editor\\2019.4.5f1\\Editor\\Unity.exe"
pipeline {
parameters {
choice(name: 'TYPE', choices: ['Debug', 'Release', 'Publisher'], description: 'Do you want cheats or speed?')
choice(name: 'BUILD', choices: ['Fast', 'Deploy', 'HealthCheck'], description: 'Fast builds run minimal tests and make a build. HealthCheck builds run more automated tests and are slower. Deploy builds are HealthChecks + a deploy.')
booleanParam(name: 'CLEAN', defaultValue: false, description: 'Tick to removed cached files - will take an eon')
booleanParam(name: 'SKIP_PLAYMODE_TESTS', defaultValue: false, description: 'In an emergency, to allow Deploy builds to work with a failing playmode test')
}
agent {
node {
label "My Project"
// force everyone to the space space, so we can share a library file.
customWorkspace 'workspace\\MyProject'
}
}
options {
timestamps()
// as a failsafe. our build tend around the 15min mark, so 45 would be excessive.
timeout(time: 45, unit: 'MINUTES')
}
// post stages only kick in once we definitely have a node
stages {
    stage('Clean') {
        when {
            expression { return params.CLEAN }
        }
        steps {
            bat "if exist Library (rmdir Library /s /q)"
            bat "if exist Temp (rmdir Temp /s /q)"
        }
    }
stage('Prewarm') {
    steps {
        script {
            // not easy to get jenkins to tell us the current branch! none of the built-in envs seem to work?
            // let's just ask svn directly.
            def get_branch_script = 'svn info | select-string "Relative URL: \\^\\/(.*)" | %{\$_.Matches.Groups[1].Value}'
            env.R7_SVN_BRANCH = powershell(returnStdout: true, script:get_branch_script).trim()
        }
buildName "${BUILD_NUMBER} - ${TYPE}@${env.R7_SVN_BRANCH}/${SVN_REVISION}"
script {
    if (params.BUILD == 'Deploy') {
        buildName "${env.BUILD_DISPLAY_NAME} ^Deploy"
    }
    if (params.BUILD == 'HealthCheck') {
        buildName "Health Check of ${TYPE}@${env.R7_SVN_BRANCH}/${SVN_REVISION}"
    }
    if (params.BUILD == 'HealthCheck' || params.BUILD == 'Deploy') {
        // let's warn that a deploy build is in progress
        slackSend color: 'good',
            message: ":hourglass: build ${env.BUILD_DISPLAY_NAME} STARTED (<${env.BUILD_URL}|Open>)",
            channel: "project_builds"
    }
}
// clean tests
bat "if exist *tests.xml (del *tests.xml)"
// need an initial open/close to clean out the serialisation. without this you can get things validating on old code!!
// do it twice, to make it more tolerant of bad libraries when switching branches
retry(count: 2) {
    bat "\"${UNITY_PATH}\" -nographics -buildTarget Win64 -quit -batchmode -projectPath . -executeMethod MyBuildFunction -MyBuildType \"${params.TYPE}\" -MyTestOnly -logFile"
}
}
}
stage ('Editmode Tests') {
    steps {
        bat "\"${UNITY_PATH}\" -nographics -batchmode -projectPath . -runTests -testResults editmodetests.xml -testPlatform editmode -logFile"
    }
}
stage ('Playmode Tests') {
    when {
        expression {
            return (params.BUILD == 'Deploy' || params.BUILD == 'HealthCheck') && !params.SKIP_PLAYMODE_TESTS
        }
    }
    steps {
        // no -nographics on playmode tests. they don't log right now? which is weird cuz the editmode tests do with almost the same setup.
        bat "\"${UNITY_PATH}\" -batchmode -projectPath . -runTests -testResults playmodetests.xml -testPlatform playmode -testCategory \"BuildServer\" -logFile"
    }
}
stage ('Build') {
    steps {
        bat "\"${UNITY_PATH}\" -nographics -buildTarget Win64 -quit -batchmode -projectPath . -executeMethod MyBuildFunction  -MyBuildType \"${params.TYPE}\" -logFile"
    }
}
stage ('Deploy') {
    when {
        expression { return params.BUILD == 'Deploy' }
    }
    steps {
        // ... how to get a build to your platform of choice ...
        slackSend color: 'good', message: ":ship: build ${env.BUILD_DISPLAY_NAME} DEPLOYED (<${env.BUILD_URL}|Open>)", channel: "project_builds"
    }
}
}
post {
    always {
        nunit testResultsPattern: '*tests.xml'
    }
    success {
        script {
            if (params.BUILD == 'HealthCheck') {
                slackSend color: 'good',
                    message: ":green_heart: build ${env.BUILD_DISPLAY_NAME} SUCCEEDED (<${env.BUILD_URL}|Open>)",
                    channel: "project_builds"
            }
        }
    }
    fixed {
        slackSend color: 'good',
            message: ":raised_hands: build ${env.BUILD_DISPLAY_NAME} FIXED (<${env.BUILD_URL}|Open>)",
            channel: "project_builds"
    }
    aborted {
        slackSend color: 'danger',
            message: ":warning: build ${env.BUILD_DISPLAY_NAME} ABORTED. Was it intentional? (<${env.BUILD_URL}|Open>)",
            channel: "project_builds"
    }
    failure {
        slackSend color: 'danger',
            message: ":red_circle: build ${env.BUILD_DISPLAY_NAME} FAILED (<${env.BUILD_URL}|Open>)",
            channel: "project_builds"
    }
}
}
Congrats to reading to the end! Your prize is a nice fish: 🐟
Now we have some useful tests, we want our Jenkins install to run them frequently. That way, we really quick feedback on failures. Here’s how we do this at Roll7.
Running tests from the command line
Let’s assume you already have a server to build your game. I won’t cover how to set up a unity Jenkins build server here, except to say that the Unity3d plugin is very helpful when you have lots of unity versions. (Although we couldn’t get the log parameter to be picked up unless we specified the path fully in our command line arguments!)
The command line to run a Unity Test Framework job is as follows:
-batchmode tells unity not to open a GUI, which is vital for a build server. We don’t want it to hang on a dialog! You can also use Application.isBatchMode to test for this flag in your code.
-projectPath "." just tells unity to load the project in our working directory
-runTests starts a Unity Test Framework job as soon as the editor loads. It’ll run some specified tests, spit out some output, and make sure test failures cause a non-zero return code.
-testPlatform playmode tells the UTF to run our playmode tests, which are the ones we care about for this blog post. You can also use editmode.
-testResults playmodetests.xml states where to spit out a report of the run, which will include failures as well as logs. The report is formatted as an nunit test result XML. Jenkins has a plugin that can fail a job based on this file, and present a nice reporting UI.
-logFile ${WORKSPACE}\playtest.txt specifies where to write the editor log – by default it won’t stream into the console. The ${WORKSPACE} is a jenkins environment variable, and we found specifying it was the only way to get the unity3d plugin to find the log.
…And that’s enough to do a test run.
Playmode tests in batch
This page of the docs mentions that the WaitForEndOfFrame coroutine is a bad idea in batch mode. This is because “systems like animation, physics and timeline might not work correctly in the Editor”.
There’s not much more detail than this!
In practice, we’ve found any playmode tests that depend on movement, positioning or animation fails pretty reliably. We get around this by explicitly marking tests we know can run on the server with the [Category("BuildServer")] attribute. We can then use the -testCategory "BuildServer" parameter to only run these tests.
This is pretty limiting! But there’s still plenty of value in just making sure your levels, enemies and weapons work without firing errors or warnings.
In the near future we’ll be experimenting with an ec2 instance that has a GPU, to let us run without batchmode, and also allow us to run playmode tests on finished builds more easily.
Gotchas and practicalities
Currently, we find a full playmode test run is exceedingly slow, and we don’t yet know why. What takes a minute or two locally takes tens of minutes on the ec2 instance. It’s not a small instance, either! So we’re only scheduling a test run for our twice-daily steam builds, instead of for every push.
WaitForEndOfFrame doesn’t work in batch mode, so beware of using that in your tests, or anything your tests depend on.
The vagaries of unity’s compile step mean that some sometimes you can get out-of-date OnValidate calls running on new data as you open the editor. Maybe this is fixable with properly defined assemblies, but we hackily get around it by doing a dummy build right at the start of the jenkins job. It goes as far as setting the correct platform, waits for all the compiles, and quits. Compile errors still cause failures, which is good.
If you want editmode and playmode tests in the same job, just run the editor twice. We do this with two different testResults xmls, and we can use a wildcard in the nunit jenkins plugin to pick up both.
To test your command line in dos, use the start command: start /wait "" "path to unity.exe" -batchmode ... The extra empty spaces are important if your unity path has spaces in it too. To see the last command’s return code in dos, use echo %ERRORLEVEL%.
These are running playmode tests in the editor on the build server. We haven’t yet got around to making playmode tests work in a build. That might end up as a follow-up post!
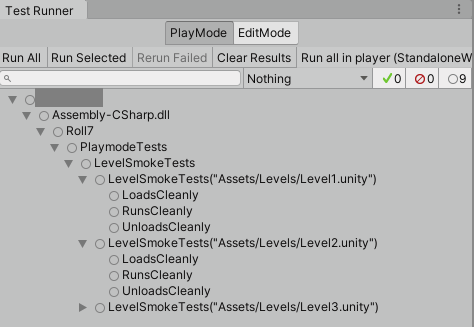
You may be familiar with Unity’s Test Runner window, where you can execute tests and see results. This is the user-facing part of the Unity Test Framework, which is a very extensible system for running tests of any kind. At Roll7 I recently set up the test runner to automatically run simple smoketests on every level of our (unannounced) game, and made jenkins report on failures. In this post I’ll outline how I did the former, and in part two I’ll cover the later.
Play mode tests, automatically generated for every level
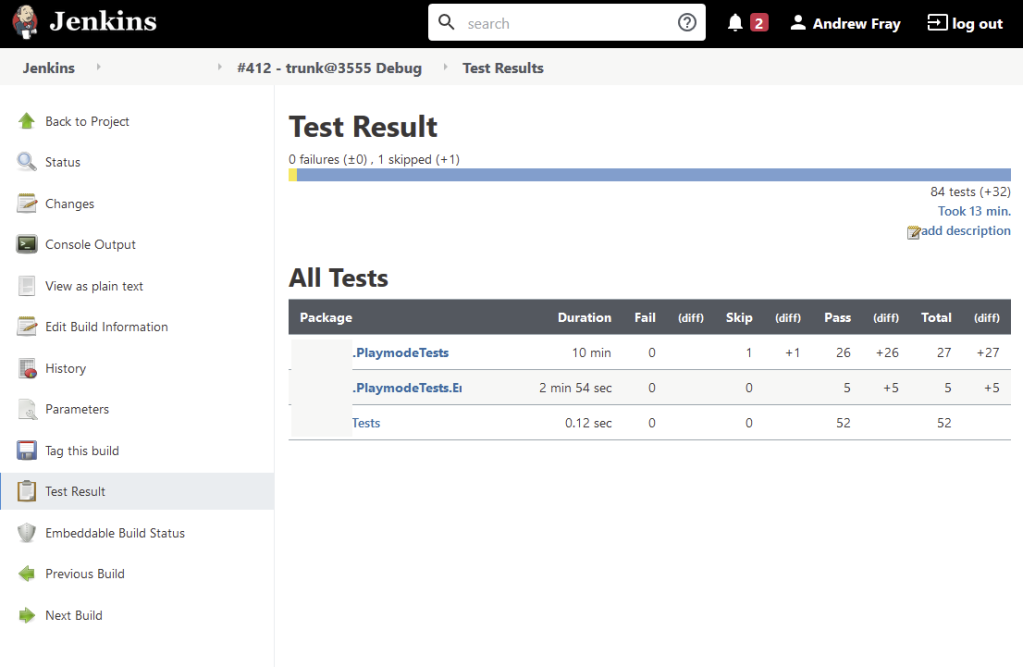
Some of our [redacted] playmode and editmode tests, running on Jenkins
(I’m going to assume you have passing knowledge of how to write tests for the test runner)
(a lot of this post is based on this interesting talk about UTF from its creators at Unite 2019)
The UTF is built upon NUnit, a .net testing framework. That’s what provides all those [TestFixture] and [Test] attributes. One feature of NUnit that UTF also supports is [TestFixtureSource]. This attribute allows you to make a sort of “meta testfixture”, a template for how to make test fixtures for specific resources. If you’re familiar with parameterized tests, it’s like that but on a fixture level.
We’re going to make a TestFixtureSource provider that finds all level scenes in our project, and then the TestFixutreSource itself that loads a specific level and runs some generic smoke tests on it. The end result is that adding a new level will automatically add an entry for it to the play mode tests list.
There’s a few options for different source providers (see the NUnit docs for more), but we’re going to make an IEnumerable that finds all our level scenes. The results of this IEnumerable are what gets passed to our constructor – you could use any type here.
class AllRequiredLevelsProvider : IEnumerable<string>
{
    IEnumerator<string> IEnumerable<string>.GetEnumerator()
    {
        var allLevelGUIDs = AssetDatabase.FindAssets("t:Scene", new[] {"Assets/Scenes/Levels"} );
        foreach(var levelGUID in allLevelGUIDs)
        {
            var levelPath = AssetDatabase.GUIDToAssetPath(levelGUID);
            yield return levelPath;
        }
    }
    public IEnumerator GetEnumerator() => (this as IEnumerable<string>).GetEnumerator();
}
Our TestFixture looks like a regular fixture, except also with the source attribute linking to our provider. Its constructor takes a string that defines which level to load.
[TestFixtureSource(typeof(AllRequiredLevelsProvider))]
public class LevelSmokeTests
{
    private string m_levelToSmoke;
    public LevelSmokeTests(string levelToSmoke)
    {
        m_levelToSmoke = levelToSmoke;
    }
Now our fixture knows which level to test, but not how to load it. TestFixtures have a [SetUp] attribute which runs before each test, but loading the level fresh for each test would be slow and wasteful. Instead let’s use [OneTimeSetup] (👀 at the inconsistent capitalisation) and to load and unload our level for each fixture. This depends somewhat on your game implementation, but for now let’s go with UnityEngine.SceneManagement:
// class LevelSmokeTests {
    [OneTimeSetUp]
    public void LoadScene()
    {
        SceneManager.LoadScene(m_levelToSmoke);
    }
Finally, we need some tests that would work on any level we throw at it. The simplest approach is probably to just watch the console for errors as we load in, sit in the level, and then as we load out. Any console errors at any of these stages should fail the test.
UTF provides LogAsset to validate the output of the log, but at this time it only lets you prescribe what should appear. We don’t care about Debug.Log() output, but want to know if there was anything worse than that. Particularly, in our case, we’d like to fail for warnings as well as errors. Too many “benign” warnings can hide serious issues! So, here’s a little utility class called LogSeverityTracker, that helps check for clean consoles. Check the comments for usage.
Our tests can use the [Order] attribute to ensure they happen in sequence:
// class LevelSmokeTests {
    [Test, Order(1)]
    public void LoadsCleanly()
    {
        m_logTracker.AssertCleanLog();
    }

    [UnityTest, Order(2)]
    public IEnumerator RunsCleanly()
    {
        // wait some arbitrary time
        yield return new WaitForSeconds(5);
        m_logTracker.AssertCleanLog();
    }

    [UnityTest, Order(3)]
    public IEnumerator UnloadsCleanly()
    {
        // how you unload is game-dependent
        yield return SceneManager.LoadSceneAsync("mainmenu");
        m_logTracker.AssertCleanLog();
    }
Now we’re at the point where you can hit Run All in the Test Runner and see each of your levels load in turn, wait a while, then unload. You’ll get failed tests for console warnings or errors, and newly-added levels will get automatically-generated test fixtures.
More tests are undoubtedly more useful than less. Depending on the complexity and setup of your game, the next steps might be to get the player to dumbly walk around for a little bit. You can get a surprising amount of info from a dumb walk!
In part 2, I’ll outline how I added all this to jenkins. It’s not egregiously hard, but it can be a bit cryptic at times.
This isn’t a full tutorial, and I’m not an expert, but I noticed this knowledge wasn’t really collected together anywhere, so I’m putting something together here. Please shout if there’s any holes or mistakes.
The CharacterMovementComponent that comes with the third-person starter kit has several movement modes you can switch between using the Set Movement Mode node. Walking, falling, swimming, and flying are all supported out-of-the-box, but there’s also a “Custom” option in the dropdown. How do you implement a new custom movement mode?
First, limitations: I’ve not found a way to make networkable custom movement modes via blueprint. I think I need to be reusing the input from Add Movement Input, but I’m not yet sure how. Without doing that, the server has no idea how to do your movement.
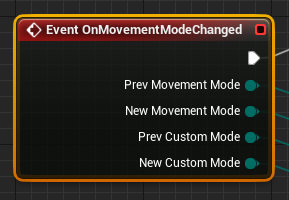
When you set a new movement mode, the OnMovementModeChanged event (which is undocumented??) gets fired:
At this point you can toggle state or meshes, zero velocity, and other things you might want to do when entering and leaving your custom mode.
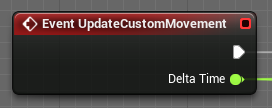
The (also undocumented) UpdateCustomMovement event will fire when you need to do movement:
From here you can read your input axis and implement your behaviours. You can just use the delta and Set Actor Location, but there’s also the Calc Velocity node which can help implement friction and deceleration for you.
To return to normal movement again, I’ve found it’s safest to use Set Movement Mode to enter Falling, and let the component sort itself out, but ymmv there.
I’m going to be in Australia for the week of the 31st October 2016. I’ll be appearing in the Unite Melbourne (https://unite.unity.com/2016/melbourne) keynote and doing an Alphabear post mortem at 5.30pm in Room 1, both on the 31st. I think the former might be streamed live? But I haven’t got a link yet.
I’m also doing a Fireside Chat at GCAP at 2.10pm on November 2nd with Laura Voss: http://gcap.com.au/sessions/laura-voss-talks-to-andrew-fray/. I’m excited about this because I don’t really know what to expect, but hopefully I can entertaining and informative. Enterformative.
I’m leaving late on the Friday, but have no other firm plans. If you’d like to meet up, let me know here or on twitter!
A computer science graduate got in touch with me via an academic friend, interested to know how they could become a games industry AI programmer. They seemed interested in what kind of masters course would help their career. Although that’s definitely possible, it’s not the route I took. My full answer follows:
…
I’m not currently an AI programmer, but I was one in a former life, on games like Operation Flashpoint Dragon Rising and F1 2010/2011. To pimp myself even more, I’ve spoken at GDC’s AI Summit, been profiled on AIGameDev.com and published a chapter in Game AI Pros 2.
The simple answer to your question is that it’s really hard to get in as a graduate AI programmer. I don’t think specific courses would help as much as devouring sites like AIGameDev.com. Infact their sister site nucl.ai has a good intro-to-AI online course that goes beyond mere pathfinding: https://courses.nucl.ai/. You can also dig into the GDC (Game Developers Conference, the biggest event in gamedev each year) vaults for lectures under the AI tag. Most recent ones are paid only, but some are free and all 3 year+ ones are free: http://www.gdcvault.com/browse/?track_category=1402.
Hopefully some of these will inspire you towards some side-project work that you can bring along to industry interviews.
The route I took was initially becoming a graduate gameplay programmer, and making it clear to my bosses that I wanted to transition into AI as fast as possible. Many smaller studios (which is almost all of them in the UK at the moment) might not have a dedicated AI programmer, so as the “AI guy” gameplay programmer, you can grab the odd task here and there that might look good on a future CV. I used that approach to do animal AI on a zoo expansion to Rollercoaster Tycoon 3, and to prototype pathfinding for thousands of actors with very limited Playstation 2 (!) resources on a rollercoaster game that was so crap I won’t namedrop it. 🙂
That took just over two years, and once I had that I was able to apply to other studios and get jobs on dedicated AI teams. All the while learning about the realities of shipping games, even if I was sometimes working on UI instead of AI. I think that’s a much better use of time than a masters. Sorry [my aforementioned academic friend] Nick!
If you’re interested in the hot topics in the gamedev AI world at the moment (which is needless to say very different from academic AI), check out monte carlo tree search, recurrent neural networks, and AI-assisted tooling. Slightly older tech includes Hierarchical Task Planners, Behaviour Trees and Utility Systems.
Hope this helps. If you have any followup questions, just shout.
…
What do you think? How did you get into the industry? How was your experience different?
People liked it last year when I re-recorded my unit testing GDC talk for youtube, so I did the same for this year’s talk on remote working at spry fox:
Here are my annotated slides to last week’s GDC talk. The attendance was good and the vibe I got was that people enjoyed it! Last year I (eventually) screencasted my unit testing talk and put it on youtube; I’ll update the blog if I get around to the same with this. It’ll also be on the GDC value soon, and I’ll ask if they’ll make it a free talk.